In this post I will take a time-series data set and using the in-database time-series functions model the data, that in turn can be used for predicting future values and trends.
The data set used in these examples is the Rossmann Store Sales data set. It is available on Kaggle and was used in one of their competitions.
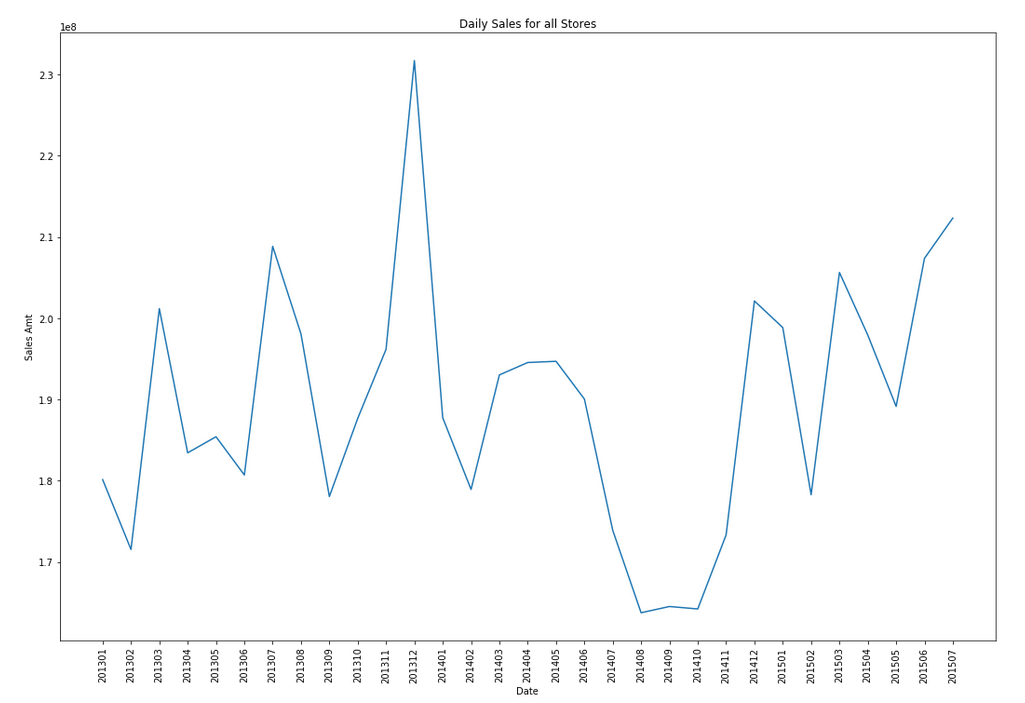
Let's start by aggregating the data to monthly level. We get.

Data Set-up
Although not strictly necessary, but it can be useful to create a subset of your time-series data to only contain the time related attribute and the attribute containing the data to model. When working with time-series data, the exponential smoothing function expects the time attribute to be of DATE data type. In most cases it does. When it is a DATE, the function will know how to process this and all you need to do is to tell the function the interval. A view is created to contain the monthly aggregated data.
-- Create input time series
create or replace view demo_ts_data as
select to_date(to_char(sales_date, 'MON-RRRR'),'MON-RRRR') sales_date,
sum(sales_amt) sales_amt
from demo_time_series
group by to_char(sales_date, 'MON-RRRR')
order by 1 asc;
Next a table is needed to contain the various settings for the exponential smoothing function.
CREATE TABLE demo_ts_settings(setting_name VARCHAR2(30),
                              setting_value VARCHAR2(128));
Some care is needed with selecting the parameters and their settings as not all combinations can be used.
Example 1 - Holt-Winters
The first example is to create a Holt-Winters time-series model for hour data set. For this we need to set the parameter to include defining the algorithm name, the specific time-series model to use (exsm_holt), the type/size of interval (monthly) and the number of predictions to make into the future, pass the last data point.
BEGIN
   -- delete previous setttings
   delete from demo_ts_settings;

   -- set ESM as the algorithm
   insert into demo_ts_settings
      values (dbms_data_mining.algo_name,
              dbms_data_mining.algo_exponential_smoothing);

   -- set ESM model to be Holt-Winters
   insert into demo_ts_settings
      values (dbms_data_mining.exsm_model,
              dbms_data_mining.exsm_holt);

   -- set interval to be month
   insert into demo_ts_settings
      values (dbms_data_mining.exsm_interval,
              dbms_data_mining.exsm_interval_month);

   -- set prediction to 4 steps ahead
   insert into demo_ts_settings
      values (dbms_data_mining.exsm_prediction_step,
              '4');

   commit;
END;
Now we can call the function, generate the model and produce the predicted values.BEGIN
-- delete the previous model with the same name
BEGIN
dbms_data_mining.drop_model('DEMO_TS_MODEL');
EXCEPTION
WHEN others THEN null;
END;
dbms_data_mining.create_model(model_name => 'DEMO_TS_MODEL',
mining_function => 'TIME_SERIES',
data_table_name => 'DEMO_TS_DATA',
case_id_column_name => 'SALES_DATE',
target_column_name => 'SALES_AMT',
settings_table_name => 'DEMO_TS_SETTINGS');
END;
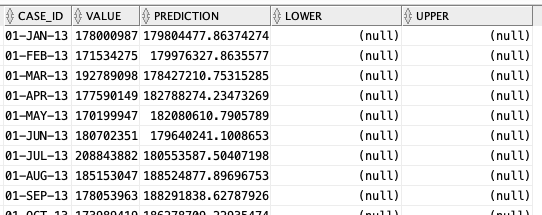
When the model is create a number of data dictionary views are populated with model details and some addition views are created specific to the model. One such view commences with DM$VP. Views commencing with this contain the predicted values for our time-series model. You need to append the name of the model create, in our example DEMO_TS_MODEL.
-- get predictions select case_id, value, prediction, lower, upper from DM$VPDEMO_TS_MODEL order by case_id;

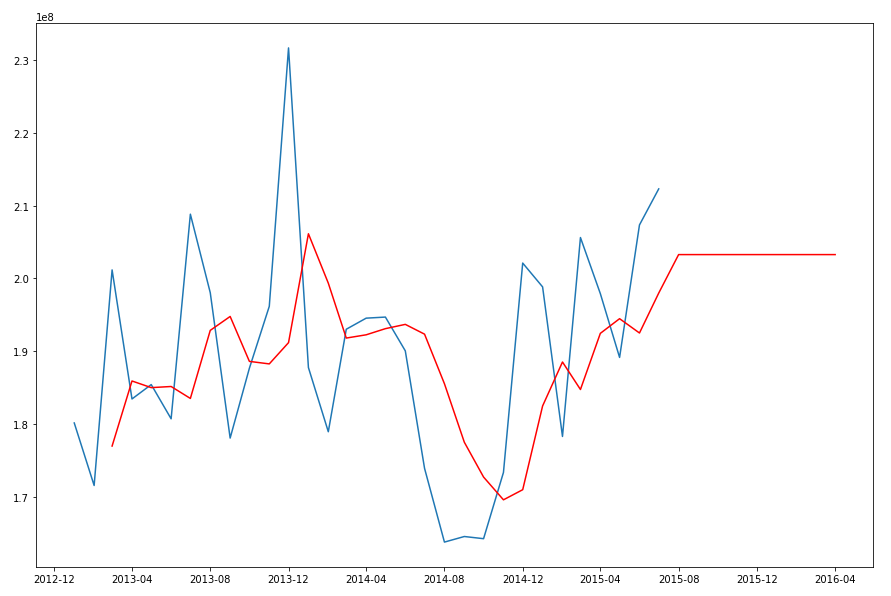
When we plot this data we get.
 The blue line contains the original data values and the red line contains the predicted values. The predictions are very similar to those produced using Holt-Winters in Python.

Example 2 - Holt-Winters including Seasonality
The previous example didn't really include seasonality int the model and predictions. In this example we introduce seasonality to allow the model to pick up any trends in the data based on a defined period. For this example we will change the model name to HW_ADDSEA, and the season size to 5 units. A data set with a longer time period would illustrate the different seasons better but this gives you an idea.
BEGIN
-- delete previous setttings
delete from demo_ts_settings;
-- select ESM as the algorithm
insert into demo_ts_settings
values (dbms_data_mining.algo_name,
dbms_data_mining.algo_exponential_smoothing);
-- set ESM model to be Holt-Winters Seasonal Adjusted
insert into demo_ts_settings
values (dbms_data_mining.exsm_model,
dbms_data_mining.exsm_HW_ADDSEA);
-- set interval to be month
insert into demo_ts_settings
values (dbms_data_mining.exsm_interval,
dbms_data_mining.exsm_interval_month);
-- set prediction to 4 steps ahead
insert into demo_ts_settings
values (dbms_data_mining.exsm_prediction_step,
'4');
-- set seasonal cycle to be 5 quarters
insert into demo_ts_settings
values (dbms_data_mining.exsm_seasonality,
'5');
commit;
END;
We need to re-run the creation of the model and produce the predicted values. This code is unchanged from the previous example.
BEGIN
   -- delete the previous model with the same name
   BEGIN
      dbms_data_mining.drop_model('DEMO_TS_MODEL');
   EXCEPTION
      WHEN others THEN null;
   END;

   dbms_data_mining.create_model(model_name => 'DEMO_TS_MODEL',
                                 mining_function => 'TIME_SERIES',
                                 data_table_name => 'DEMO_TS_DATA',
                                 case_id_column_name => 'SALES_DATE',
                                 target_column_name => 'SALES_AMT',
                                 settings_table_name => 'DEMO_TS_SETTINGS');
END;
When we re-query the DM$VPDEMO_TS_MODEL we get the new values. When plotted we get.

The blue line contains the original data values and the red line contains the predicted values.
Comparing this chart to the chart from the first example we can see there are some important differences between them. These differences are particularly evident in the second half of the chart, on the right hand side. We get to see there is a clearer dip in the predicted data. This mirrors the real data values better. We also see better predictions as the time line moves to the end.
When performing time-series analysis you really need to spend some time exploring the data, to understand what is happening, visualizing the data, seeing if you can identifying any patterns, before moving onto using the different models. Similarly you will need to explore the various time-series models available and the parameters, to see what works for your data and follow the patterns in your data. There is not magic solution in this case.
No comments:
Post a Comment