Wednesday, August 29, 2018

Bringing Neural Networks to Production using GraphPipe

Machine learning is a fascinating topic. It has so much potential yet very few people talk about using machine learning in production. I've been highlighting the need for this for over 20 years now and only a very small number of machine learning languages and solutions are suitable for production use. Why? maybe it is due to the commercial aspects and as many of the languages and tools are driven by the open source community, one of the last things they get round to focusing on is production deployment. Rightly they are focused at developing more and more machine learning algorithms and features for developing models, but where the real value comes is will being able to embed machine learning model scoring in production system. Maybe this why the dominant players with machine learning in enterprises are still the big old analytics companies.

Yes that was a bit a of a rant but it is true. But over the summer and past few months there has been a number of articles about production deployment.

But this is not a new topic. For example, we have Predictive Model Markup Language (PMML) around for a long time. The aim of this was to allow the interchange of models between different languages. This would mean that the data scientist could develop their models using one language and then transfer or translate the model into another language that offers the same machine learning algorithms.

But the problem with this approach is that you may end up with different results being generated by the model in the development or lab environment versus the model being used in production. Why does this happen? Well the algorithms are developed by different people/companies and everyone has their preferences for how these algorithms are implemented.

To over come this some companies would rewrite their machine learning algorithms and models to ensure that development/lab results matched the results in production. But there is a very large cost associated with this development and ongoing maintenance as the models evolved. This would occur, maybe, every 3, 6, 9, 12 months. Somethings the time to write or rewrite each new version of the model would be longer than its lifespan.

These kind of problems have been very common and has impacted on model deployment in production.

In the era of cloud we are now seeing some machine learning cloud solutions making machine learning models available using REST services. These can, very easily, allow for machine learning models to be included in production applications. You are going to hear more about this topic over the coming year.

But, despite all the claims and wonders and benefits of cloud solutions, it isn't for everyone. Maybe at some time in the future but it mightn't be for some months or years to come.

So, how can we easily add machine learning model scoring/labeling to our production systems? Well we need some sort of middleware solutions.

Given the current enthusiasm for neural networks, and the need for GPUs, means that these cannot (easily) be deployed into production applications.

There have been some frameworks put forward for how to enable this. Once such framework is called Graphpipe. This has recently been made open source by Oracle.

Graphpipe

Graphpipe is a framework that to access and use machine learning models developed and running on different platforms. The framework allows you to perform model scoring across multiple neural networks models and create ensemble solutions based on these. Graphpipe development has been focused on performance (most other frameworks don't). It uses flatbuffers for efficient transfer of data and currently has integration with TensorFlow, PyTorch, MXNet, CNTK and via ONNX and caffe2.

Expect to have more extensions added to the framework.

Graphpipe website

Graphpipe getting started

Graphpipe blogpost

Graphpipe download

Monday, August 13, 2018

Spark docker images

Spark is a very popular environment for processing data and doing machine learning in a distributed environment.

When working in a development environment you might work on a single node. This can be your local PC or laptop, as not everyone will have access to a multi node distributed environment.

But what if you could spin up some docker images there by creating additional nodes for you to test out the scalability of your Spark code.

There are links to some Docker images that may help you to do this.

Or simply create a cloud account on the Databricks Community website to create your own Spark environment to play and learn.

Thursday, August 2, 2018

A selection of Hadoop Docker Images

When it comes to big data platforms one of the biggest challenges is getting a test environment setup where you can try out the various components. There are a few approaches to doing this this. The first is to setup your own virtual machine or some other container with the software. But this can be challenging to get just a handful of big data applications/software to work on one machine.

But there is an alternative approach. You can use one of the preconfigured environments from the likes of AWS, Google, Azure, Oracle, etc. But in most cases these come with a cost. Maybe not in the beginning but after a little us you will need to start handing over some dollars. But these require you to have access to the cloud i.e. wifi, to run these. Again not always possible!

So what if you want to have a local big data and Hadoop environment on your own PC or laptop or in your home or office test lab? There ware a lot of Virtual Machines available. But most of these have a sizeable hardware requirement. Particularly for memory, with many requiring 16+G of RAM ! Although in more recent times this might not be a problem but for many it still is. Your machines do not have that amount or your machine doesn't allow you to upgrade.

What can you do?

Have you considered using Docker? There are many different Hadoop Docker images available and these are not as resource or hardware hungry, unlike the Virtual Machines.

Here is a list of some that I've tried out and you might find them useful.

Cloudera QuickStart image

You may have tried their VM, now go dry the Cloudera QuickStart docker image.

Read about it here.

Check our Docker Hub for lots and lots of images.

Docker Hub is not the only place to get Hadoop Docker images. There are lots on GitHub Just do a quick Google search to find the many, many, many images.

These Docker Hadoop images are a great way for you to try out these Big Data platforms and environments with the minimum of resources.

Monday, July 23, 2018

Lessor known Apache Machine Learning languages

Machine learning is a very popular topic in recent times, and we keep hearing about languages such as R, Python and Spark. In addition to these we have commercially available machine learning languages and tools from SAS, IBM, Microsoft, Oracle, Google, Amazon, etc., etc. Everyone want a slice of the machine learning market!

The Apache Foundation supports the development of new open source projects in a number of areas. One such area is machine learning. If you have read anything about machine learning you will have come across Spark, and maybe you might believe that everyone is using it. Sadly this isn't true for lots of reasons, but it is very popular. Spark is one of the project support by the Apache Foundation.

But are there any other machine learning projects being supported under the Apache Foundation that are an alternative to Spark? The follow lists the alternatives and lessor know projects: (most of these are incubator/retired/graduated Apache projects)

Flink Flink is an open source system for expressive, declarative, fast, and efficient data analysis. Stratosphere combines the scalability and programming flexibility of distributed MapReduce-like platforms with the efficiency, out-of-core execution, and query optimization capabilities found in parallel databases. Flink was originally known as Stratosphere when it entered the Incubator.

Documentation

(graduated)

HORN HORN is a neuron-centric programming APIs and execution framework for large-scale deep learning, built on top of Apache Hama.

Wiki Page

(Retired)

HiveMail Hivemall is a library for machine learning implemented as Hive UDFs/UDAFs/UDTFs

Apache Hivemall offers a variety of functionalities: regression, classification, recommendation, anomaly detection, k-nearest neighbor, and feature engineering. It also supports state-of-the-art machine learning algorithms such as Soft Confidence Weighted, Adaptive Regularization of Weight Vectors, Factorization Machines, and AdaDelta. Apache Hivemall offers a variety of functionalities: regression, classification, recommendation, anomaly detection, k-nearest neighbor, and feature engineering. It also supports state-of-the-art machine learning algorithms such as Soft Confidence Weighted, Adaptive Regularization of Weight Vectors, Factorization Machines, and AdaDelta.

Documentation

(incubator)

MADlib Apache MADlib is an open-source library for scalable in-database analytics. It provides data-parallel implementations of mathematical, statistical and machine learning methods for structured and unstructured data. Key features include: Operate on the data locally in-database. Do not move data between multiple runtime environments unnecessarily; Utilize best of breed database engines, but separate the machine learning logic from database specific implementation details; Leverage MPP shared nothing technology, such as the Greenplum Database and Apache HAWQ (incubating), to provide parallelism and scalability.

Documentation

(graduated)

MXNet A Flexible and Efficient Library for Deep Learning . MXNet provides optimized numerical computation for GPUs and distributed ecosystems, from the comfort of high-level environments like Python and R MXNet automates common workflows, so standard neural networks can be expressed concisely in just a few lines of code.

Webpage

(incubator)

OpenNLP OpenNLP is a machine learning based toolkit for the processing of natural language text. OpenNLP supports the most common NLP tasks, such as tokenization, sentence segmentation, part-of-speech tagging, named entity extraction, chunking, parsing, language detection and coreference resolution.

Documentation

(graduated)

PredictionIO PredictionIO is an open source Machine Learning Server built on top of state-of-the-art open source stack, that enables developers to manage and deploy production-ready predictive services for various kinds of machine learning tasks.

Documentation

(graduated)

SAMOA SAMOA provides a collection of distributed streaming algorithms for the most common data mining and machine learning tasks such as classification, clustering, and regression, as well as programming abstractions to develop new algorithms that run on top of distributed stream processing engines (DSPEs). It features a pluggable architecture that allows it to run on several DSPEs such as Apache Storm, Apache S4, and Apache Samza.

Documentation

(incubator)

SINGA SINGA is a distributed deep learning platform. An intuitive programming model based on the layer abstraction is provided, which supports a variety of popular deep learning models. SINGA architecture supports both synchronous and asynchronous training frameworks. Hybrid training frameworks can also be customized to achieve good scalability. SINGA provides different neural net partitioning schemes for training large models.

Documentation

(incubator)

Storm Storm is a distributed, fault-tolerant, and high-performance realtime computation system that provides strong guarantees on the processing of data. Storm makes it easy to reliably process unbounded streams of data, doing for realtime processing what Hadoop did for batch processing. Storm is simple, can be used with any programming language.

Documentation

(graduated)

SystemML SystemML provides declarative large-scale machine learning (ML) that aims at flexible specification of ML algorithms and automatic generation of hybrid runtime plans ranging from single node, in-memory computations, to distributed computations such as Apache Hadoop MapReduce and Apache Spark.

Documentation

(graduated)

Big data ml

I will have a closer look that the following SQL based machine learning languages in a lager blog post:

- MADlib

- Storm

Thursday, July 12, 2018

Oracle Developer Champion

Yesterday evening I received an email titled 'Invitation to Developer Champion Program'.

What a surprise!
Oracle dev champion
The Oracle Developer Champion program was setup just a year ago and is aimed at people who are active in generating content and sharing their knowledge on new technologies including cloud, micro services, containers, Java, open source technologies, machine learning and various types of databases.
For me, I fit into the machine learning, cloud, open source technologies, a bit on chatbots and various types of databases areas. Well I think I do!

This made me look back over my activities for the past 12-18 months. As an Oracle ACE Director, we have to record all our activities. I'd been aware that the past 12-18 months had been a bit quieter than previous years. But when I looked back at all the blog posts, articles for numerous publications, books, and code contributions, etc. Even I was impressed with what I had achieved, even though it was a quiet period for me.

Membership of Oracle Developer Champion program is for one year, and the good people in Oracle Developer Community (ODC) will re-evaluate what I, and the others in the program, have been up to and will determine if you can continue for another year.

In addition to writing, contributing to projects, presenting, etc Oracle Developer Champions typically have leadership roles in user groups, answering questions on forums and providing feedback to product managers.

The list of existing Oracle Developer Champions is very impressive. I'm honoured to be joining this people.

Click on the image to go to the Oracle Developer Champion website to find out more.
Screen Shot 2018 07 12 at 17 21 32

And check out the list of existing Oracle Developer Champions.
 Oracle dev champion O ACEDirectorLogo clr

Thursday, June 28, 2018

My book on Oracle R Enterprise translated into Chinese

A couple of days ago the post man knocked on my door with a package. I hadn't ordered anything, so it was a puzzling what it might be.

When I opened the package I found 3 copies of a book in Chinese.

It was one of my books !

One of my books was translated into Chinese !

What a surprise, as I wasn't aware this was happening.

At this time I'm not sure where you can purchase the book, but I'll update this blog post when I find out.

Monday, June 18, 2018

Twitter Analytics using Python - Part 3

This is my third (of five) post on using Python to process Twitter data.

Check out my all the posts in the series.

In this post I'll have a quick look at how to save the tweets you have download. By doing this allows you to access them at a later point and to perform more analysis. You have a few instances of saving the tweets. The first of these is to save them to files and the second option is to save them to a table in a database.

Saving Tweets to files

In the previous blog post (in this series) I had converged the tweets to Pandas and then used the panda structure to perform some analysis on the data and create some charts. We have a very simple command to save to CSV.

# save tweets to a file
tweets_pd.to_csv('/Users/brendan.tierney/Dropbox/tweets.csv', sep=',')

We can inspect this file using a spreadsheet or some other app that can read CSV files and get the following.

Twitter app8

When you want to read these tweets back into your Python environment, all you need to do is the following.

# and if we want to reuse these tweets at a later time we can reload them
old_tweets = pd.read_csv('/Users/brendan.tierney/Dropbox/tweets.csv')

old_tweets

Tweet app9

That's all very easy!


Saving Tweets to a Database

There are two ways to add tweets to table in the database. There is the slow way (row-by-row) or the fast way doing a bulk insert.

Before we get started with inserting data, lets get our database connection setup and the table to store the tweets for our date. To do this we need to use the cx_oracle python library. The following codes shows the setting up of the connections details (without my actual login details), establishes the connects and then retrieves some basic connection details to prove we are connected.

# import the Oracle Python library
import cx_Oracle

# define the login details
p_username = "..."
p_password = "..."
p_host = "..."
p_service = "..."
p_port = "1521"

# create the connection
con = cx_Oracle.connect(user=p_username, password=p_password, dsn=p_host+"/"+p_service+":"+p_port)
cur = con.cursor()

# print some details about the connection and the library
print("Database version:", con.version)
print("Oracle Python version:", cx_Oracle.version)


Database version: 12.1.0.1.0
Oracle Python version: 6.3.1

Now we can create a table based on the current date.

# drop the table if it already exists
#drop_table = "DROP TABLE TWEETS_" + cur_date
#cur.execute(drop_table)

cre_table = "CREATE TABLE TWEETS_" + cur_date + " (tweet_id number, screen_name varchar2(100), place varchar2(2000), lang varchar2(20), date_created varchar2(40), fav_count number, retweet_count number, tweet_text varchar2(200))"

cur.execute(cre_table)

Now lets first start with the slow (row-by-row) approach. To do this we need to take our Panda data frame and convert it to lists that can be indexed individually.

lst_tweet_id = [item[0] for item in rows3]
lst_screen_name = [item[1] for item in rows3]
lst_lang =[item[3] for item in rows3]
lst_date_created = [item[4] for item in rows3]
lst_fav_count = [item[5] for item in rows3]
lst_retweet_count = [item[6] for item in rows3]
lst_tweet_text = [item[7] for item in rows3]

#define a cursor to use for the the inserts
cur = con.cursor()
for i in range(len(rows3)):
    #do the insert using the index. This can be very slow and should not be used on big data
    cur3.execute("insert into TWEETS_2018_06_12 (tweet_id, screen_name, lang, date_created, fav_count, retweet_count, tweet_text) values (:arg_1, :arg_2, :arg_3, :arg_4, :arg_5, :arg_6, :arg_7)",
                 {'arg_1':lst_tweet_id[i], 'arg_2':lst_screen_name[i], 'arg_3':lst_lang[i], 'arg_4':lst_date_created[i],
                  'arg_5':lst_fav_count[i], 'arg_6':lst_retweet_count[i], 'arg_7':lst_tweet_text[i]})

#commit the records to the database and close the cursor
con.commit()
cur.close()

Tweet app10

Now let us look a quicker way of doing this.

WARNING: It depends on the version of the cx_oracle library you are using. You may encounter some errors relating to the use of floats, etc. You might need to play around with the different versions of the library until you get the one that works for you. Or these issues might be fixed in the most recent versions.

The first step is to convert the panda data frame into a list.

rows = [tuple(x) for x in tweets_pd.values]
rows

Tweet app11

Now we can do some cursor setup like setting the array size. This determines how many records are sent to the database in each batch. Better to have a larger number than a single digit number.

cur = con.cursor()

cur.bindarraysize = 100

cur2.executemany("insert into TWEETS_2018_06_12 (tweet_id, screen_name, place, lang, date_created, fav_count, retweet_count, tweet_text) values (:1, :2, :3, :4, :5, :6, :7, :8)", rows)

Check out the other blog posts in this series of Twitter Analytics using Python.

Monday, June 4, 2018

Twitter Analytics using Python - Part 2

This is my second (of five) post on using Python to process Twitter data.

Check out my all the posts in the series.

In this post I was going to look at two particular aspects. The first is the converting of Tweets to Pandas. This will allow you to do additional analysis of tweets. The second part of this post looks at how to setup and process streaming of tweets. The first part was longer than expected so I'm going to hold the second part for a later post.

Step 6 - Convert Tweets to Pandas

In my previous blog post I show you how to connect and download tweets. Sometimes you may want to convert these tweets into a structured format to allow you to do further analysis. A very popular way of analysing data is to us Pandas. Using Pandas to store your data is like having data stored in a spreadsheet, with columns and rows. There are also lots of analytic functions available to use with Pandas.

In my previous blog post I showed how you could extract tweets using the Twitter API and to do selective pulls using the Tweepy Python library. Now that we have these tweet how do I go about converting them into Pandas for additional analysis? But before we do that we need to understand a bit more a bout the structure of the Tweet object that is returned by the Twitter API. We can examine the structure of the User object and the Tweet object using the following commands.

dir(user)

['__class__',
 '__delattr__',
 '__dict__',
 '__dir__',
 '__doc__',
 '__eq__',
 '__format__',
 '__ge__',
 '__getattribute__',
 '__getstate__',
 '__gt__',
 '__hash__',
 '__init__',
 '__init_subclass__',
 '__le__',
 '__lt__',
 '__module__',
 '__ne__',
 '__new__',
 '__reduce__',
 '__reduce_ex__',
 '__repr__',
 '__setattr__',
 '__sizeof__',
 '__str__',
 '__subclasshook__',
 '__weakref__',
 '_api',
 '_json',
 'contributors_enabled',
 'created_at',
 'default_profile',
 'default_profile_image',
 'description',
 'entities',
 'favourites_count',
 'follow',
 'follow_request_sent',
 'followers',
 'followers_count',
 'followers_ids',
 'following',
 'friends',
 'friends_count',
 'geo_enabled',
 'has_extended_profile',
 'id',
 'id_str',
 'is_translation_enabled',
 'is_translator',
 'lang',
 'listed_count',
 'lists',
 'lists_memberships',
 'lists_subscriptions',
 'location',
 'name',
 'needs_phone_verification',
 'notifications',
 'parse',
 'parse_list',
 'profile_background_color',
 'profile_background_image_url',
 'profile_background_image_url_https',
 'profile_background_tile',
 'profile_banner_url',
 'profile_image_url',
 'profile_image_url_https',
 'profile_link_color',
 'profile_location',
 'profile_sidebar_border_color',
 'profile_sidebar_fill_color',
 'profile_text_color',
 'profile_use_background_image',
 'protected',
 'screen_name',
 'status',
 'statuses_count',
 'suspended',
 'time_zone',
 'timeline',
 'translator_type',
 'unfollow',
 'url',
 'utc_offset',
 'verified']

dir(tweets)

['__class__',
 '__delattr__',
 '__dict__',
 '__dir__',
 '__doc__',
 '__eq__',
 '__format__',
 '__ge__',
 '__getattribute__',
 '__getstate__',
 '__gt__',
 '__hash__',
 '__init__',
 '__init_subclass__',
 '__le__',
 '__lt__',
 '__module__',
 '__ne__',
 '__new__',
 '__reduce__',
 '__reduce_ex__',
 '__repr__',
 '__setattr__',
 '__sizeof__',
 '__str__',
 '__subclasshook__',
 '__weakref__',
 '_api',
 '_json',
 'author',
 'contributors',
 'coordinates',
 'created_at',
 'destroy',
 'entities',
 'favorite',
 'favorite_count',
 'favorited',
 'geo',
 'id',
 'id_str',
 'in_reply_to_screen_name',
 'in_reply_to_status_id',
 'in_reply_to_status_id_str',
 'in_reply_to_user_id',
 'in_reply_to_user_id_str',
 'is_quote_status',
 'lang',
 'parse',
 'parse_list',
 'place',
 'retweet',
 'retweet_count',
 'retweeted',
 'retweets',
 'source',
 'source_url',
 'text',
 'truncated',
 'user']

We can see all this additional information to construct what data we really want to extract.

The following example illustrates the searching for tweets containing a certain word and then extracting a subset of the metadata associated with those tweets.

oracleace_tweets = tweepy.Cursor(api.search,q="oracleace").items()
tweets_data = []
for t in oracleace_tweets:
   tweets_data.append((t.author.screen_name,
                       t.place,
                       t.lang,
                       t.created_at,
                       t.favorite_count,
                       t.retweet_count,
                       t.text.encode('utf8')))

We print the contents of the tweet_data object.

print(tweets_data)

[('jpraulji', None, 'en', datetime.datetime(2018, 5, 28, 13, 41, 59), 0, 5, 'RT @tanwanichandan: Hello Friends,\n\nODevC Yatra is schedule now for all seven location.\nThis time we have four parallel tracks i.e. Databas…'), ('opal_EPM', None, 'en', datetime.datetime(2018, 5, 28, 13, 15, 30), 0, 6, "RT @odtug: Oracle #ACE Director @CaryMillsap is presenting 2 #Kscope18 sessions you don't want to miss! \n- Hands-On Lab: How to Write Bette…"), ('msjsr', None, 'en', datetime.datetime(2018, 5, 28, 12, 32, 8), 0, 5, 'RT @tanwanichandan: Hello Friends,\n\nODevC Yatra is schedule now for all seven location.\nThis time we have four parallel tracks i.e. Databas…'), ('cmvithlani', None, 'en', datetime.datetime(2018, 5, 28, 12, 24, 10), 0, 5, 'RT @tanwanichandan: Hel ......

I've only shown a subset of the tweets_data above.

Now we want to convert the tweets_data object to a panda object. This is a relative trivial task but an important steps is to define the columns names otherwise you will end up with columns with labels 0,1,2,3...

import pandas as pd

tweets_pd = pd.DataFrame(tweets_data,
                         columns=['screen_name', 'place', 'lang', 'created_at', 'fav_count', 'retweet_count', 'text'])

Now we have a panda structure that we can use for additional analysis. This can be easily examined as follows.

tweets_pd

 	screen_name 	place 	lang 	created_at 	fav_count 	retweet_count 	text
0 	jpraulji 	None 	en 	2018-05-28 13:41:59 	0 	5 	RT @tanwanichandan: Hello Friends,\n\nODevC Ya...
1 	opal_EPM 	None 	en 	2018-05-28 13:15:30 	0 	6 	RT @odtug: Oracle #ACE Director @CaryMillsap i...
2 	msjsr 	None 	en 	2018-05-28 12:32:08 	0 	5 	RT @tanwanichandan: Hello Friends,\n\nODevC Ya...

Now we can use all the analytic features of pandas to do some analytics. For example, in the following we do a could of the number of times a language has been used in our tweets data set/panda, and then plot it.

import matplotlib.pyplot as plt

tweets_by_lang = tweets_pd['lang'].value_counts()
print(tweets_by_lang)

lang_plot = tweets_by_lang.plot(kind='bar')
lang_plot.set_xlabel("Languages")
lang_plot.set_ylabel("Num. Tweets")
lang_plot.set_title("Language Frequency")

en    182
fr      7
es      2
ca      2
et      1
in      1

Pandas1

Similarly we can analyse the number of times a twitter screen name has been used, and limited to the 20 most commonly occurring screen names.

tweets_by_screen_name = tweets_pd['screen_name'].value_counts()
#print(tweets_by_screen_name)

top_twitter_screen_name = tweets_by_screen_name[:20]
print(top_twitter_screen_name)

name_plot = top_twitter_screen_name.plot(kind='bar')
name_plot.set_xlabel("Users")
name_plot.set_ylabel("Num. Tweets")
name_plot.set_title("Frequency Twitter users using oracleace")

oraesque           7
DBoriented         5
Addidici           5
odtug              5
RonEkins           5
opal_EPM           5
fritshoogland      4
svilmune           4
FranckPachot       4
hariprasathdba     3
oraclemagazine     3
ritan2000          3
yvrk1973           3
...

Pandas2

There you go, this post has shown you how to take twitter objects, convert them in pandas and then use the analytics features of pandas to aggregate the data and create some plots.


Check out the other blog posts in this series of Twitter Analytics using Python.

Wednesday, May 30, 2018

Call for Papers : UKOUG Annual Conferences : Closes 4th June at 9am (UK)

The call for Papers (presentations) for the UKOUG Annual Conferences is open until 9am (UK time) on Monday 4th June.

Ukoug18

Me: What are you waiting for? Go and submit a topic! Why not!

You: Humm, well..., (excuse, excuse, ...)

Me: What?

You: I couldn't do that! Present at a conference?

Me: Why not?

You: That is only for experts and I'm not one.

Me: Wrong! If you have a story to tell, then you can present.

You: But I've never presented before, it scares me, but one day I'd like to try.

Me: Go for it, do it. If you want you can co-present with me.

You: But, But, But .....


I'm sure you have experienced something like the above conversation before. You don't have to be an expert to present, you don't have to know everything about a product to present, you don't have to be using the latest and brightest technologies to present, you don't have to present about something complex, etc. (and the list goes on and on)

The main thing to remember is, if you have a story to tell then that is your presentation. Be it simple, complex, only you might be interested in it, it involves making lots of bits of technology work, you use a particular application in a certain way, you found something interesting, you used a new process, etc (and the list goes on and on)

I've talked to people who "ranted" for two hours about a certain topic (its was about Dates in Oracle), but when I said you should give a presentation on that, they say NO, I couldn't do that!. (If you are that person and you are reading this, then go on and submit that presentation).

If you don't want to present alone, then reach out to someone else and ask them if they are interested in co-presenting. Most experienced presenters would be very happy to do this.

You: But the topic area I'll talk about is not listed on the submission page?

Me: Good point, just submit it and pick the topic area that is closest.

You: But my topic would be of interest to the APPs and Tech conference, what do I do?

Me: Submit it to both, and let the agenda planners work out where it will fit.

I've presented at both APPs and Tech over the years and sometimess my Tech submission has been moved and accepted for the APPs conf, and vice versa.

Just do it!

Just do it

Monday, May 28, 2018

Twitter Analytics using Python - Part 1

(This is probably the first part of, probably, a five part blog series on twitter analytics using Python. Make sure to check out the other posts and I'll post a wrap up blog post that will point to all the posts in the series)

(Yes there are lots of other examples out there, but I've put these notes together as a reminder for myself and a particular project I'm testing)

In this first blog post I will look at what you need to do get get your self setup for analysing Tweets, to harvest tweets and to do some basics. These are covered in the following five steps.

Step 1 - Setup your Twitter Developer Account & Codes

Before you can start writing code you need need to get yourself setup with Twitter to allow you to download their data using the Twitter API.

To do this you need to register with Twitter. To do this go to apps.twitter.com. Log in using your twitter account if you have one. If not then you need to go create an account.

Next click on the Create New App button.

Twitter app1

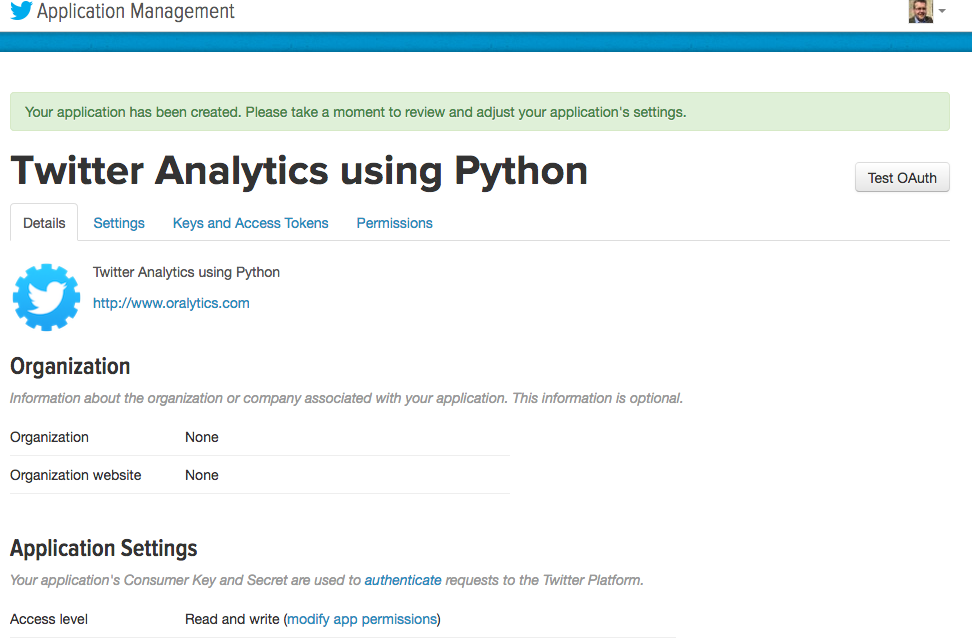
Then give the Name of your app (Twitter Analytics using Python), a description, a webpage link (eg your blog or something else), click on the 'add a Callback URL' button and finally click the check box to agree with the Developer Agreement. Then click the 'Create your Twitter Application' button.

You will then get a web page like the following that contains lots of very important information. Keep the information on this page safe as you will need it later when creating your connection to Twitter.

Twitter app2

The details contained on this web page (and below what is shown in the above image) will allow you to use the Twitter REST APIs to interact with the Twitter service.

Step 2 - Install libraries for processing Twitter Data

As with most languages there is a bunch of code and libraries available for you to use. Similarly for Python and Twitter. There is the Tweepy library that is very popular. Make sure to check out the Tweepy web site for full details of what it will allow you to do.

To install Tweepy, run the following.

pip3 install tweepy

It will download and install tweepy and any dependencies.

Step 3 - Initial Python code and connecting to Twitter

You are all set to start writing Python code to access, process and analyse Tweets.

The first thing you need to do is to import the tweepy library. After that you will need to use the important codes that were defined on the Twitter webpage produced in Step 1 above, to create an authorised connection to the Twitter API.

Twitter app3

After you have filled in your consumer and access token values and run this code, you will not get any response.

Step 4 - Get User Twitter information

The easiest way to start exploring twitter is to find out information about your own twitter account. There is a API function called 'me' that gathers are the user object details from Twitter and from there you can print these out to screen or do some other things with them. The following is an example about my Twitter account.

#Get twitter information about my twitter account
user = api.me()

print('Name: ' + user.name)
print('Twitter Name: ' + user.screen_name)
print('Location: ' + user.location)
print('Friends: ' + str(user.friends_count))
print('Followers: ' + str(user.followers_count))
print('Listed: ' + str(user.listed_count))

Twitter app4

You can also start listing the last X number of tweets from your timeline. The following will take the last 10 tweets.

for tweets in tweepy.Cursor(api.home_timeline).items(10):
    # Process a single status
    print(tweets.text)
Twitter app5

An alternative is, that returns only 20 records, where the example above can return X number of tweets.

public_tweets = api.home_timeline()
for tweet in public_tweets:
    print(tweet.text)

Step 5 - Get Tweets based on a condition

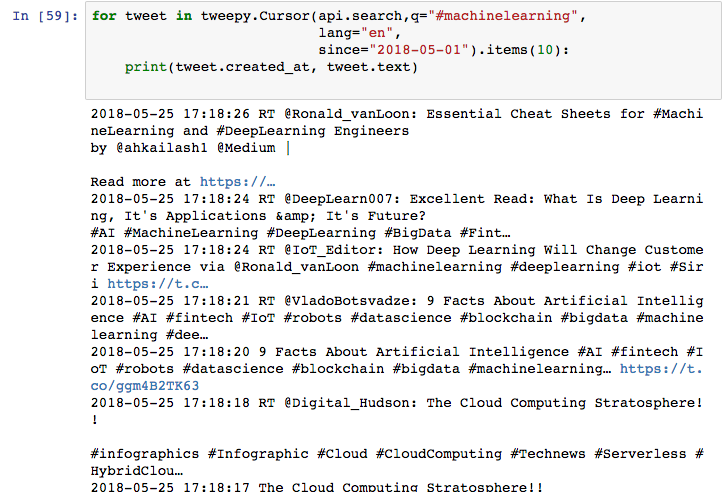
Tweepy comes with a Search function that allows you to specify some text you want to search for. This can be hash tags, particular phrases, users, etc. The following is an example of searching for a hash tag.

for tweet in tweepy.Cursor(api.search,q="#machinelearning",
                           lang="en",
                           since="2018-05-01").items(10):
    print(tweet.created_at, tweet.text)

Twitter app7

You can apply additional search criteria to include restricting to a date range, number of tweets to return, etc


Check out the other blog posts in this series of Twitter Analytics using Python.

Saturday, May 26, 2018

UKOUG EPM & Hyperion Event 6th June, 2018

Come up really soon is the annual EPM and Hyperion event organised by the UKOUG. This year it will be on 6th June at Sandown Park Racecourse (Portsmouth Rd, Esher, KT10 9AJ).

Epm1

If you have ever been to Sandown Park Racecourse you will know how fantastic a venue it is. And if you have been to a previous UKOUG EPM & Hyperion event before you will know how amazing it is.

Just go and book you place for this event now. If you are a UKOUG member this event could be free (depending on level of membership) but if you aren't a member, you can still go to this event. You can either become a UKOUG member and attend the event or pay the small event fee and attend the event.

From what I've heard a lot of people have already signed up to go, and I can see why. The agenda is jammed packed with end-user and customer case studies, as well as presentations from key people from Oracle people and and leading Oracle partners.

Epm2

The exhibition space has been sold out! This will give you plenty of opportunities to get talking to various partners and service providers, and get your key questions answered at this event.

There will be a Panel Session at the end of the day. I love these panel sessions and gives everyone a chance to ask questions or to listen, or to join in with the discussion.

Lots and lots of value and learning to be had at this event. Go register now.

Monday, May 21, 2018

Creating a Word Cloud using Python

Over the past few days I've been doing a bit more playing around with Python, and create a word cloud. Yes there are lots of examples out there that show this, but none of them worked for me. This could be due to those examples using the older version of Python, libraries/packages no long exist, etc. There are lots of possible reasons. So I have to piece it together and the code given below is what I ended up with. Some steps could be skipped but this is what I ended up with.

Step 1 - Read in the data

In my example I wanted to create a word cloud for a website, so I picked my own blog for this exercise/example. The following code is used to read the website (a list of all packages used is given at the end).

import nltk
from urllib.request import urlopen
from bs4 import BeautifulSoup

url = "http://www.oralytics.com/"
html = urlopen(url).read()
print(html)

The last line above, print(html), isn't needed, but I used to to inspect what html was read from the webpage.

Step 2 - Extract just the Text from the webpage

The Beautiful soup library has some useful functions for processing html. There are many alternative ways of doing this processing but this is the approached that I liked.

The first step is to convert the downloaded html into BeautifulSoup format. When you view this converted data you will notices how everything is nicely laid out.

The second step is to remove some of the scripts from the code.

soup = BeautifulSoup(html)
print(soup)

# kill all script and style elements
for script in soup(["script", "style"]):
    script.extract()    # rip it out
    
print(soup)

Step 3 - Extract plain text and remove whitespacing

The first line in the following extracts just the plain text and the remaining lines removes leading and trailing spaces, compacts multi-headlines and drops blank lines.

text = soup.get_text()
print(text)

# break into lines and remove leading and trailing space on each
lines = (line.strip() for line in text.splitlines())
# break multi-headlines into a line each
chunks = (phrase.strip() for line in lines for phrase in line.split("  "))
# drop blank lines
text = '\n'.join(chunk for chunk in chunks if chunk)

print(text)

Step 4 - Remove stop words, tokenise and convert to lower case

As the heading says this code removes standard stop words for the English language, removes numbers and punctuation, tokenises the text into individual words, and then converts all words to lower case.

#download and print the stop words for the English language
from nltk.corpus import stopwords
#nltk.download('stopwords')
stop_words = set(stopwords.words('english'))
print(stop_words)

#tokenise the data set
from nltk.tokenize import sent_tokenize, word_tokenize
words = word_tokenize(text)
print(words)

# removes punctuation and numbers
wordsFiltered = [word.lower() for word in words if word.isalpha()]
print(wordsFiltered)

# remove stop words from tokenised data set
filtered_words = [word for word in wordsFiltered if word not in stopwords.words('english')]
print(filtered_words)
Step 5 - Create the Word Cloud

Finally we can create a word cloud backed on the finalised data set of tokenised words. Here we use the WordCloud library to create the word cloud and then the matplotlib library to display the image.

from wordcloud import WordCloud
import matplotlib.pyplot as plt

wc = WordCloud(max_words=1000, margin=10, background_color='white',
               scale=3, relative_scaling = 0.5, width=500, height=400,
               random_state=1).generate(' '.join(filtered_words))

plt.figure(figsize=(20,10))
plt.imshow(wc)
plt.axis("off")
plt.show()
#wc.to_file("/wordcloud.png")

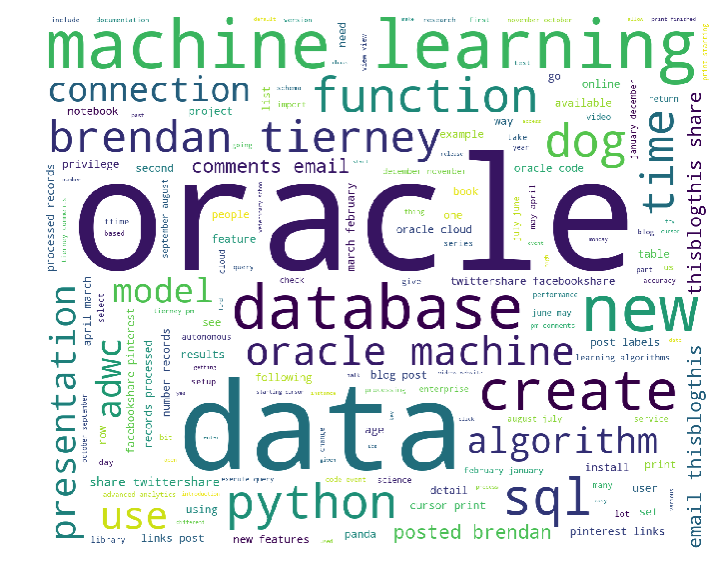
We get the following word cloud.

Wordcloud1

Step 6 - Word Cloud based on frequency counts

Another alternative when using the WordCloud library is to generate a WordCloud based on the frequency counts. For this you need to build up a table containing two items. The first item is the distinct token and the second column contains the number of times that word/token appears in the text. The following code shows this code and the code to generate the word cloud based on this frequency count.

from collections import Counter

# count frequencies
cnt = Counter()
for word in filtered_words:
    cnt[word] += 1

print(cnt)

from wordcloud import WordCloud
import matplotlib.pyplot as plt

wc = WordCloud(max_words=1000, margin=10, background_color='white',
               scale=3, relative_scaling = 0.5, width=500, height=400,
               random_state=1).generate_from_frequencies(cnt)

plt.figure(figsize=(20,10))
plt.imshow(wc)
#plt.axis("off")
plt.show()

Now we get the following word cloud.

Wordcloud2

When you examine these word cloud to can easily guess what the main contents of my blog is about. Machine Learning, Oracle SQL and coding.

What Python Packages did I use?

Here are the list of Python libraries that I used in the above code. You can use PIP3 to install these into your environment.

nltk
url open
BeautifulSoup
wordcloud
Counter