Friday, May 31, 2013

Introducing Java EE7–Live Webcast 12th June, 2013

There will be live Wecast on June 12 (2013) on Introducing Java EE7. There will be some keynotes, some break out sessions that you can attend and you will have the opportunity to chat with some Java experts. The highlights of this event include:

  • Business Keynote (Hasan Rizvi and Cameron Purdy)
  • Technical Keynote (Linda DeMichiel)
  • Breakout Sessions on different JSRs by specification leads
  • Live Chat
  • Lots of Demos
  • Community, Partner, and Customer video testimonials

This is a free event, so sign up now to book your place.

image

I joined a conference call on Thursday that was organised for members of the Oracle ACE program. This a full 1 hour conference call, presented by Arun Gupta. He spent the one hour call going through some of the new features coming in Java EE7

Wednesday, May 22, 2013

OUG Ireland BI & Tech SIGs June 2013

On 11th and 12th June we will be having our next SIG meetings for BI and Tech. The BI SIG will be on the 11th June in the Oracle offices in East Point. We then move the the Conrad Hotel on the 12th June for the Tech SIG. Here are the agendas for the 2 days.

BI SIG

image

Tech SIG

image

These events are open to everyone, are free for members and a small fee for non-members.

To register for these event go to the following links

Monday, May 20, 2013

DBMS_PREDICTIVE_ANALYTICS & Explain

There are 2 PL/SQL packages for performing data mining/predictive analytics in Oracle. The main PL/SQL package is DBMS_DATA_MINING. This package allows you to build data mining models and to apply them to new data. But there is another PL/SQL package.

The DBMS_PREDICTIVE_ANALYTICS package is very different to the DBMS_DATA_MINING package. The DBMS_PREDICTIVE_ANALYTICS package includes routines for predictive analytics, an automated form of data mining. With predictive analytics, you do not need to be aware of model building or scoring. All mining activities are handled internally by the predictive analytics procedure.

Predictive analytics routines prepare the data, build a model, score the model, and return the results of model scoring. Before exiting, they delete the model and supporting objects.

The package comes with the following functions: EXPLAIN, PREDICT and PROFILE. To get some of details about these functions we can run the following in SQL.

image

This blog post will look at the EXPLAIN function.

EXPLAIN creates an attribute importance model. Attribute importance uses the Minimum Description Length algorithm to determine the relative importance of attributes in predicting a target value. EXPLAIN returns a list of attributes ranked in relative order of their impact on the prediction. This information is derived from the model details for the attribute importance model.

Attribute importance models are not scored against new data. They simply return information (model details) about the data you provide.

I’ve written two previous blog posts on Attribute Importance. One of these was on how to calculate Attribute Importance using the Oracle Data Miner tool. In the ODM tool it is now called Feature Selection and is part of the Filter Columns node and the Attribute Importance model is not persisted in the database.  The second blog post was how you can create the Attribute Importance using the DBMS_DATA_MINING package.

EXPLAIN ranks attributes in order of influence in explaining a target column.

The syntax of the function is

DBMS_PREDICTIVE_ANALYTICS.EXPLAIN (
data_table_name IN VARCHAR2,
explain_column_name IN VARCHAR2,
result_table_name IN VARCHAR2,
data_schema_name IN VARCHAR2 DEFAULT NULL);


where


data_table_name = Name of input table or view


explain_column_name = Name of column to be explained


result_table_name = Name of table where results are saved. It creates a new table in your schema.


data_schema_name = Name of schema where the input table or view resides. Default: the current schema.


So when calling the function you do not have to include the last parameter.


Using the same example what I have given in the previous blog posts (see about for the links to these) the following command can be run to generate the Attribute Importance.


BEGIN

    DBMS_PREDICTIVE_ANALYTICS.EXPLAIN(


        data_table_name      => 'mining_data_build_v',


        explain_column_name  => 'affinity_card',


        result_table_name    => 'PA_EXPLAIN');


END;


One thing that stands out is that it is a bit slower to run than the DBMS_DATA_MINING method. On my laptop it took approx. twice to three time longer to run. But in total it was less than a minute.


To display the results,


image


The results are ranked in a 0 to 1 range. Any attribute that had a negative value are set to zero.

Thursday, May 16, 2013

Outputting your data using inbuilt SQL Dev formatting

Oracle has build a number of formatting options into SQL Developer to allow you to output your data in some standard formats. This removes the need to use other tools or to write extra code or performs various follow up steps.
All you need to do is to add a comment and use the Scrip button
SELECT /*csv*/ * FROM scott.emp;
SELECT /*xml*/ * FROM scott.emp;
SELECT /*html*/ * FROM scott.emp;
SELECT /*delimited*/ * FROM scott.emp;
SELECT /*insert*/ * FROM SCOTT.EMP;
SELECT /*loader*/ * FROM scott.emp;
SELECT /*fixed*/ * FROM scott.emp;
SELECT /*text*/ * FROM scott.emp;

Hint: for some of these it is best to list the schema and table name in upper case
These are comments and not hints so they will not work in SQL*Plus.

Wednesday, May 15, 2013

Review of Oracle Magazine-July/August 1999

The headline articles for the July/August 1999 edition of Oracle Magazine were focused on Business Intelligence and included topics on architectures, business plans, data integration, portals, dashboards, Oracle Express, data marts and data warehouses.

image

Other articles included:

  • 15 Rules for Enterprise Portals
    • Gear it to casual users
    • Use intuitive classifications and searching
    • Allow access to a publish/subscribe engine
    • Enable universal connectivity to information resources
    • Provide dynamic access to information resources
    • Set up intelligent routing
    • Integrate a business intelligence toolset
    • Use a server based architecture
    • Build in distributed, multithreaded services
    • Enable flexible permission granting
    • Append external interfaces
    • Provide programmatic interfaces
    • Establish internet security
    • Make it cost effective to deploy
    • Ensure that it can be customized and personalized
  • Oracle Application Server release 4.0.8 was available for beta testing and includes support for Enterprise JavaBeans. Java Servlets, Java Server Pages and allows developers to build robust self service applications quickly
  • Oracle and MapInfo joined forces to release an internet-based spatial-data analysis solution to help organizations to understand and visualize data and to identify patterns and customer trends
  • Oracle makes available Oracle iTV platform, that is a solution that makes it possible for broadcast, cable and telecommunications providers to deliver interactive services .
  • Nine tips for using Oracle Discover included:
    • Us the decode statement
    • Implement summary redirection
    • create optional conditions (filters)
    • use query statistics
    • perform regular maintenance on the query statistics tables
    • familiarize yourself with the EUL tables
    • make regular backups
    • modify registry settings
    • delete objects with care
  • Standardizing your interfaces. The first of a three part article on creating interfaces to the database. This article focused on showing how to setup and use UTL_FILE for loading data into and getting data out of the database.
  • Creating a Virtual Private Database in Oracle 8i describes how to approach such a project to implement fine grained access control and gives the following steps for setting up a VPD
    • create the application context
    • create a package that sets the context
    • create the policy function
    • associate the policy function with a table or view

To view the cover page and the table of contents click on the image at the top of this post or click here.

My Oracle Magazine Collection can be found here. You will find links to my blog posts on previous editions and a PDF for the very first Oracle Magazine from June 1987.

Monday, May 13, 2013

Recent Big Data and Analytics related articles

Over the past couple of weeks I’ve come across the following articles, blog posts and discussions about Big Data and Analytics. There seems to be an underlying theme of ‘let’s get back to the core of the problem’ and big data is not that useful and only in certain cases.

As the Analytics 3.0 article indicates we should be concentrating on how we can use analytics to achieve a real goal for the organisation.

Analytics 3.0

Most data isn’t “big,” and businesses are wasting money pretending it is

   - There is a LinkedIn discussion about this article

7 Myths about Big Data

Most data sets are 40-60GB range – I can do that on my laptop, so that cannot be Big Data

Big Data Hype (and Reality)

It is also interesting to note that most of the people who have been working in the area for years (10+) are not believes in Big Data or they don’t even consider calling themselves Data Scientists.

The 10 Most Influential People in Data Analytics, Data Mining, Predictive Analytics


The purpose of this post to to record these links in one place and to share with everyone else who might be interested.

Friday, May 10, 2013

Getting Real Business Value from Oracle Data Mining and OBIEE

Over the past 16 months (or so) I have give a join presentation with Anthony Heljula called ‘Getting Real Business Value from Oracle Data Mining and OBIEE’, at a number of conferences and OUG SIGs.

We have had a lot of very positive feedback on this presentation. The presentation is a busy 45 minutes (questions only at the end) that walks through a pilot data science project we did for a University in the UK.

We used Oracle Data Miner to build a predictive model that looks at student churn. We then integrated this Student Churn model into OBIEE Dashboards to illustrate how combining an Oracle Data Miner model into our data analysis we can gain a greater insight of our data.

image

We have submitted this presentation for Oracle Open World 2013 but we have renamed the title of the presentation to

“How UK Universities are using Oracle Data Science to protect their income”

If you are involved in presentation selection or know someone who is then maybe you might select this to be presented at OOW13 in September.

We submitted the presentation for OOW12 with not luck. So fingers crossed this time.

Wednesday, May 8, 2013

New website for my blog

A few days ago I moved my blog to a new domain name

www.oralytics.com

Check it out. Wait you already are if you are reading this Smile

The domain name is a merger of Oracle and Analytics, and has a familiar ring to it for those of you who know Oracle.

The old web link still works (for now)

brendantierneydatamining.blogspot.com

I’ll be look to update the look and feel over the coming months.

Thursday, April 25, 2013

Oracle Magazine-September/October 1999

The headline articles in the September/October 1999 edition of Oracle Magazine focused on how the Oracle technology can be used to educate staff and to keep their skills up to date. either on site or remote via on-demand training resources.

image

Other articles included:

  • Oracle announce that they have acquired Thinking Machine’s data mining business. This data mining product was called Darwin and is now called Oracle Data Mining. I will have a separate blog post for this announcement.
  • Oracle 8i Lite has shipped and comes with three component: Oracle Lite a single user (50K to 750K foot print), Web-to-Go allows users to access the same data and web applications both online and offline, iConnect that was a flexible architecture that enables reliable and scalable bi-directional synchronization of data and applications. Oracle 8i Lite was supported on MS Windows 95, 98 and NT, Windows CE, Palm OS and EPOC 32.
  • Oracle XML Parser for C and Oracle XML Parser for C++ are released and supports DOM and Simple API for XML (SAX) interfaces.
  • Oracle XML SQL utilities and XSQL Servlet facilitates the reading and writing of XML information from and to the Oracle database.
  • Siemens announce that they plan to build an Oracle 8i Applicance on its Primergy line of servers, based on Intel Pentium II Xeon processors.
  • Singapore Telecom’s Magix Server delivers the World’s first nationwide video on demand service. Their 12,000 subscriber were able to use a web-browser to select a video from the Megix Web side and SingTel automates the streaming of them to their computer.
  • Oracle 8i comes with some improvements in PL/SQL. These included Autonomous Transactions, Native Dynamic SQL, Invoker rights procedures, user-defined operators, new operators, bulk binds.
  • Part 2 of the article on exporting an Oracle Database to a Flat File. In this part of the article it looks at how you can use the UTL_FILE package.
  • How you can speed up query response times by using a Materialized Views. The article suggests the following steps to analyze the performance impact:
    • Configure the server parameters
    • Grant privileges to the appropriate schema
    • Create a materialized view
    • Refresh the optimizer statistics
    • Confirm that the materialized view is being used
    • Manually refresh a materialized view
  • Oracle introduces Oracle Log Miner to allow a DBA to analyze the REDO log files

Tuesday, April 23, 2013

Oracle buys Darwin back in 1999

The following is an extract from 1999 September/October edition of Oracle Magazine, about Oracle buying Thinking Machines. Their data mining software Darwin was integrated into the Oracle Database and renamed Oracle Data Miner.

Oracle Corporation’s recent acquisition of Thinking Machines’ data mining business extends Oracle’s data warehouse platform and business intelligence solution to include enterprise reporting, ad hoc query, advanced analysis and data mining software based on a common internet platform.

Oracle plans to incorporate the data mining software as an integral feature of Oracle Applications Customer Relationship Management site, which will facilitate the implementation of the e0business solutions developed by Oracle customers. In addition o the software technology, Oracle will receive rights to the domains think.com and thinkingmachines.com.

About Thinking Machines

Originally founded in 1983, Thinking Machines Corporation revolutionized high performance computing with its massively parallel supercomputing technology. The company has since evolved to focus exclusively on its Darwin data mining software for database marketing in the financial services and telecommunications industries. Darwin analyzes massive volumes of customer transaction, demographic and psychographic data, which can often amount to hundreds of millions of customer data records.

These advanced analyses help companies profile and target customers with greater accuracy, which allows companies to reduce customer attrition, assess customer profitability, cross sell to existing customers and detect fraud.

Darwin puts powerful data mining techniques in the hands of general business users and experienced analysts alike. Each to use wizards automate data mining while providing advanced users with full control over all options and parameters. The Darwin software combines advanced analytics - including neural networks, decisions trees and memory based reasoning, with impressive power and performance.

The solution’s one button model code generation, powerful scripting language and robust software development kit bring prediction capabilities to sales, call center, marking and the web.

Platforms and Languages

Darwin runs on Sun Microsystems and Hewlett-Packard servers and exports data mining models in C, C++ and Java for execution within Oracle Databases. A Microsoft Windows NT release is planned for later this year.”

Friday, April 19, 2013

Part 2–Getting start with Statistics for Oracle Data Science projects

This is the second blog on getting started with Statistics for Oracle Data Science projects.

In this blog post I will look at 3 more useful statistical functions that are available in the Oracle database. Remember these come are standard with the database. The first function I will look at is the WIDTH_BUCKET function. This can be used to create some histograms of the data. A common task in analytics projects is to produce some cross tabs of the data. Oracle has the STATS_CROSSTAB. The last function I will look the different ways you an sample the data.

Histograms using WIDTH_BUCKET

When exploring your data it is useful to group values together into a number of buckets. Typically you might want to define the width of each bucket yourself before passing the data into your data mining tools, but before you can decide what these are you need to do some exploring using a variety of widths. A good way to do this is to use the WIDTH_BUCKET function. This takes the following inputs:

Expression: This is the expression or attribute on which the you want to build the histogram.

Min Value: This is the lower or starting value of the first bucket

Max Value: This is the last or highest value for the last bucket

Num Buckets: This is the number of buckets you want created.

Typically the Min Value and the Max Value can be calculated using the MIN and MAX functions. As a starting point you generally would select 10 for the number of buckets. This is the number you will change, downwards as well as upwards, to if a particular pattern exists in the attribute.

Using the example scenario that I used in the first blog post, let us start by calculating the MIN and MAX for the AGE attribute.

image

Lets say that we wanted to create 10 buckets. This would create a bucket width of 7.3 for each bucket, giving us the following.

Bucket 1 : 17-24.3
Bucket 2: 24.3-31.6
Bucket 3: 31.6-38.8
Bucket 4: 38.8-46.1
Bucket 5: 46.1-53.4
Bucket 6: 53.4-60.7
Bucket 7: 60.7-68
Bucket 8: 68-75.3
Bucket 9: 75.3-82.6
Bucket 10: 82.6-90

These are the buckets that the WIDTH_BUCKET function gives us in the following:

SELECT cust_id,
       age,
       width_bucket(age,
                    (SELECT min(age) from mining_data_build_v),
                    (select max(age)+1 from mining_data_build_v),
                    10)  bucket
from mining_data_build_v
where rownum <=12
group by cust_id, age

image

An additional level of detail that is needed to allow us to plot the histograms for AGE, we need to aggregate up for all the records by bucket.

select intvl, count(*) freq
from (select width_bucket(salary,
(select min(salary) from employees),
(select max(salary)+1 from employees), 10) intvl
from HR.employees)
group by intvl
order by intvl;

image

We can take this code and embed it into the GATHER_DATA_STATS procedure that I gave in my Part 1 blog post.

Cross Tabs using STATS_CROSSTAB

Typically cross tabulation (or crosstabs for short) is a statistical process that summarises categorical data to create a contingency table. They provide a basic picture of the interrelation between two variables and can help find interactions between them.

Because Crosstabs creates a row for each value in one variable and a column for each value in the other, the procedure is not suitable for continuous variables that assume many values.

In Oracle we can perform crosstabs using one of their reporting tools. But if you don’t have one of these we will need to use the in-database function STATS_CROSSTAB. This function takes three parameters, the first two of these are the attributes you want to compare and the third is what test we want to perform. The tests available include:

  • CHISQ_OBS: Observed value of chi-squared
  • CHISQ_SIG: Significance of observed chi-squared
  • CHISQ_DF: Degree of freedom for chi-squared
  • PHI_COEFFICIENT: Phi coefficient
  • CRAMERS_V: Cramer’s V statistic
  • CONT_COEFFICIENT: Contingency coefficient
  • COHENS_K: Cohen’s kappa

CHISQ_SIG is the default.

Now let us look at some examples using our same data set.

image

Sampling Data

When our datasets are of relatively small size consisting of a few hundred thousand records we can explore the data is a relatively short period of time. But if your data sets are larger that that you may need to explore the data by taking a sample of it. What sampling does is that it takes a “random” selection of records from our data set up to the new number of records we have specified in the sample.

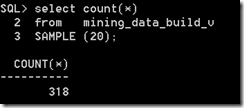
In Oracle the SAMPLE function takes a percentage figure. This is the percentage of the entire data set you want to have in the Sampled result. 
image

There is also a variant called SAMPLE BLOCK and the figure given is the percentage of records to select from each block.

image

Each time you use the SAMPLE function Oracle will generate a random seed number that it will use as a Seed for the SAMPLE function. If you omit a Seed number (like in the above examples), you will get a different result set in each case and the result set will have a slightly different number of records. If you run the sample code above over and over again you will see that the number of records returned varies by a small amount.

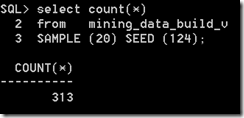
If you would like to have the same Sample data set returned each time then you will need to specify a Seed value. The Seed much be an integer between 0 and 4294967295.
image

In this case because we have specified the Seed we get the same “random” records being returned with each execution.